To view survey answers, go to Surveys > Answers (Reports).
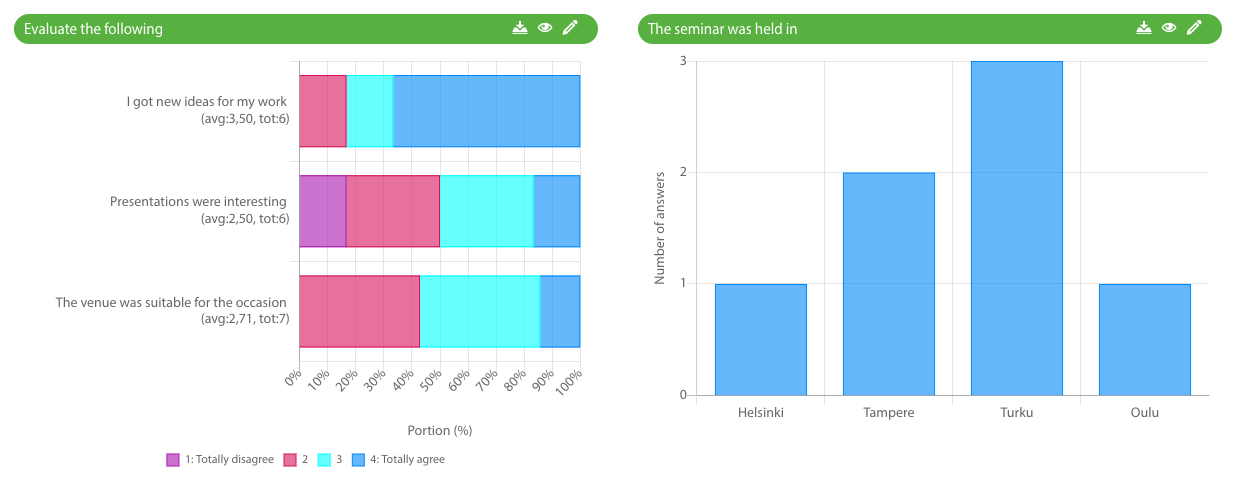
Answers are shown in diagrams or text depending on the question type. Multiple choice questions and scale of value questions are shown as diagrams, where as text and date questions are shown as lists.

This article contains the following sections:
Filter report

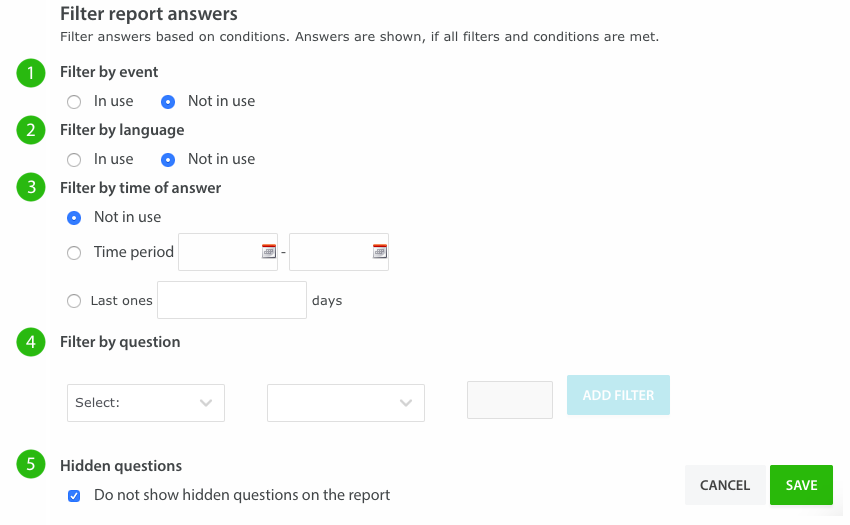
You can filter results to view answers of a certain event, compare results of different questions or time frames. As a default the reports page will show you all the answers to all the questions in your survey.

- Filter by event: Use if you want to see results of a certain event connected with the survey.
- Filter by language: Use if you want to see results given in different languages.
- Filter by time of answer: Use if you want to see results given over a certain time frame, for example the last 30 days.
- Filter by question: Select question and its answer that the respondent must have in order to appear on the report. Remember to click on Add filter to activate filter.
- Hidden questions: Do not show hidden questions on the report. Select option if you have questions that are hidden from the survey but and you wish to leave them out of the reports.
All filters are AND filters, meaning that answers will be shown on the report if all the conditions are met.
Finally, Save to see filtered results.
Compare answers
If you want to compare the filtered answers, click Move in the report menu, which will move the report to the right hand side of the page. The left hand report will display all answers. On a very narrow screen the filtered report will move under the original report.
Manage charts

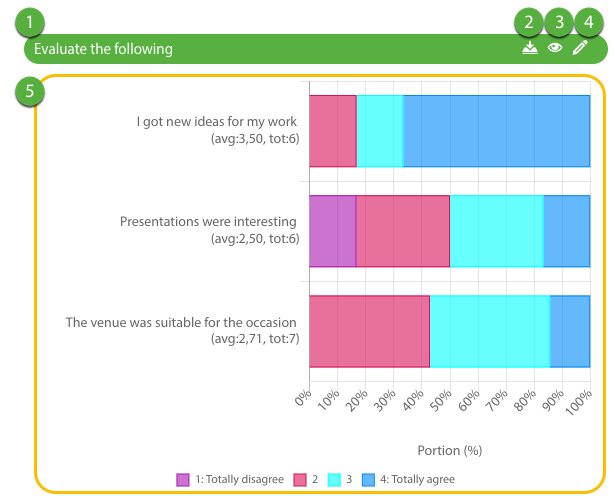
In each chart you'll find:
- Name of the question.
- Download chart in png format.
- Hide chart from the report by clicking the eye icon.
- Edit chart settings by clicing the pen icon.
- Answers to the question.
- The form in which answers are presented depends of the question type.
- To select a different chart type, click on the pen icon (4).
By hovering the mouse over a chart, you'll get more detailed information of each question/answer.
Create online report
Online reports show answers real-time. The report can be found behind a link which can be forwarded to anyone who needs to view results.
To create an online report, go to Surveys > Answers (Reports).
- By default, reports will include all questions listed on the page.
- If necessary, Filter results or edit/hide charts (see above).
Click Create online report to save the report as an online report.

- Give a name to the report. The name is visible to everyone with access to the report.
- Valid until: Determine how long the report may be viewed in a browser.
- Show links to answers in table form in the report:Answers can be downloaded as an Excel file. If your survey has a lot of background questions and you wish to keep the anonymity of the respondents, do not select this option.
- Prevent other users from editing report: Select if you have shared rights to the survey with your colleagues and you wish to prevent them from editing the report's settings.
- Protect the report with a password: The report's URL is very complex and extremely hard to guess, but if necessary, it can still be protected with a password.
 Finally, Save the report.
The report is saved under Saved reports (top right corner of Reports page, or on a narrow screen, below the report's answers).

Functions:
- Edit report
- Online report's link - click to open and copy link
- Preview report
- Delete report
If the report is not saved as an online report, it can only be edited or deleted, viewing the report is done directly on the reports page.

Comments
0 comments
Please sign in to leave a comment.